

 Italiano
 Français
 Español
 Português (Brasil)
 Deutsch
M2R Simulation › Articles › The evolution of physics in Assetto Corsa EVO, from 0.5 to 0.9: what 34,000 races say
Data analysis · 9 min readThe evolution of physics in Assetto Corsa EVO, from 0.5 to 0.9: what 34,000 races say
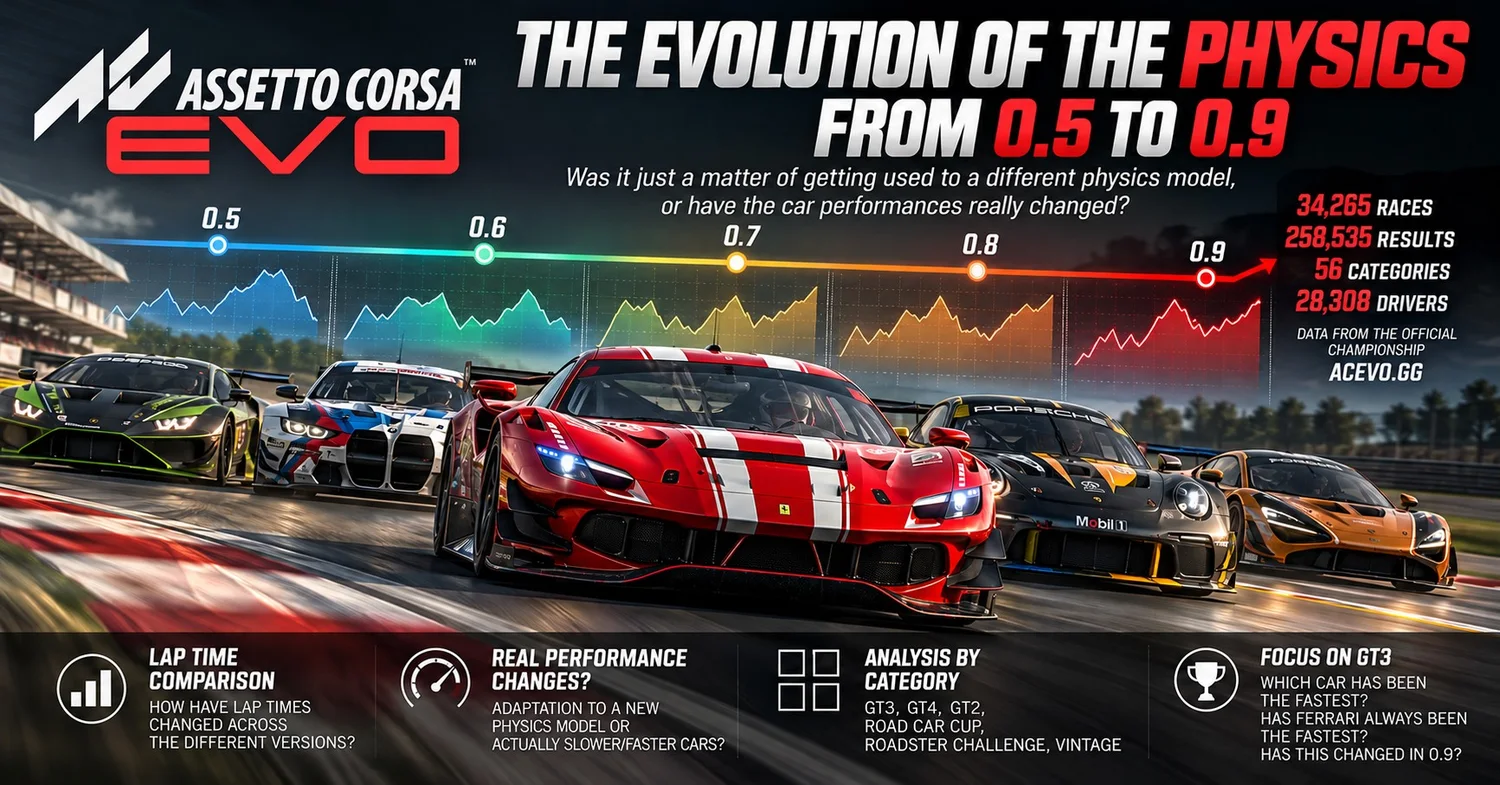
Is it just habit, or has performance really changed? We have the races of every version of EVO since 0.5, and the answer is in the numbers: with 0.9 race cars lap 1.2% slower on average for the same driver and track, up to 2.4% in the Mazda MX-5 Cup. Road cars, over the same period, stayed where they were. And the Ferrari 296 GT3, the car with the best pace from 0.6 to 0.8 (−0.45%, −0.39% and −0.37% against the GT3 average, same driver), loses its advantage with 0.9: −0.02%. Audi R8 LMS GT3 Evo II and Porsche 911 GT3 R move ahead.
The data: every race, every version
We have every race of the Assetto Corsa EVO daily championship since 16 February 2026, the same ones you find on ACE Daily: 34,265 races, 258,535 results, 28,308 different drivers, in 56 weekly editions of 14 series. Every race is assigned to the game version it was driven in, with the exact release date of each update (0.6 on 15 April, 0.7 on 3 June, 0.8 on 9 July, 0.9 on 26 August).
For every driver, track, car and version we take their best lap in the race. For the series analysis we used the ones that come back every week in every version: GT3 Sprint Cup, GT4 Super Sprint, The Ring and Roadster Challenge. That is more than 62,000 best laps of individual drivers, from 18,700 different drivers. The GT3 Sprint Cup starts with 0.6: the championship did not run GT3 cars before that version, so the GT3 comparison starts there.
How to measure physics without the driver
Comparing average times between two versions is not enough: people change, new drivers arrive, the strongest ones race more in some weeks, series run on different tracks. So we built a model that removes the driver and the track from the equation. For every lap the model tells three things apart: how strong that driver is, how slow that track is with that car, and what the game version does. The driver stays the same, the track stays the same, the car stays the same: what changes is the physics.
Drivers who raced in several versions, even on different tracks, link all the versions together. It is like measuring the same person with the same ruler at five different moments. The intervals you will see in the tables (±) are 95% confidence intervals computed by resampling the drivers: where the interval does not include zero, the change is real.
A second, independent method compares the same car + track cells directly between one version and the next. For 0.9 it gives +1.5%, in line with the +1.2% of the same-driver model. The two methods agree.
What Kunos declared, version by version
Before the numbers, the official facts. The patch notes say this about physics:
| Version | Released | Physics: what the patch notes say |
|---|---|---|
| 0.6 | 15 April | New tyre contact model (triangular contact patch), stiffer race compounds, GT2 reworked, first balancing of the GT3 cars (engine only), Performance Index recalibrated. |
| 0.7 | 3 June | No change to the tyre models. Balancing of the BMW M3 E30 and Mercedes 190E; the Audi R8 GT3 Evo II and Porsche GT2 RS arrive. |
| 0.8 | 9 July | Work on the relationship between tyre and track: road temperature model, grip evolution maps rebuilt, camber computed geometrically. |
| 0.9 | 26 August | “Updated tyre model for racing slicks – deployed on GT racing cars”. Also an improved LSD differential and fixes to all-wheel drive. |
The 0.9 line is short, but Kunos testers have explained elsewhere that the new model concerns the slick tyres of GT and Cup cars, from the Mazda MX-5 Cup to the Ferrari F40 LM, and not road tyres. They also warned that old setups may need to be rebuilt. It is a precise statement, and so it can be checked against the data.
Version after version: what happened to the lap times
The chart tells three phases. From 0.5 to 0.6 the main change is the Mazda MX-5 Cup. Between 0.6 and 0.8 the lines stay within about one percentage point: the physics is stable and times move by a few tenths. With 0.9 all four series go up together. From 0.8 to 0.9 the lap time increases by +1.18% (±0.11) on average: it is not chance, nor the effect of one particular week, because the same jump shows up in series with different cars and tracks.
| Series | 0.5 → 0.6 | 0.6 → 0.7 | 0.7 → 0.8 | 0.8 → 0.9 |
|---|---|---|---|---|
| GT3 Sprint Cup | – | −0.39% ± 0.10 | −0.01% ± 0.12 | +1.34% ± 0.14 |
| GT4 Super Sprint | −0.09% ± 0.38 | −0.20% ± 0.28 | −0.21% ± 0.30 | +1.04% ± 0.27 |
| The Ring | −0.90% ± 0.25 | −0.65% ± 0.20 | +0.43% ± 0.33 | +1.40% ± 0.22 |
| Roadster Challenge | +3.66% ± 0.22 | −0.02% ± 0.27 | −0.99% ± 0.35 | +2.44% ± 0.28 |
| Average of the four series | – | −0.17% ± 0.09 | +0.11% ± 0.12 | +1.18% ± 0.11 |
Change in lap time between consecutive versions, same driver, track and car (+ = slower, − = faster). 95% confidence interval.
- 0.5 → 0.6. The Mazda MX-5 Cup is the only one with a strong change: +3.7% on the lap, meaning it is much slower in 0.6. It coincides with the new contact model and the stiffer race compounds of that version. The other series change by less than a point.
- 0.6 → 0.8. A period of stability: GT3 and GT4 move by a few tenths, and the Roadster Challenge gains about one point in 0.8 (−1.0%), the version that worked on the relationship between tyre and track.
- 0.8 → 0.9. The change that involves all the series together: GT4 +1.04%, GT3 +1.34%, The Ring +1.40%, Mazda MX-5 Cup +2.44%.
Habit or physics?
It is the question we all ask after an update. With the same-driver model we have the answer: it is physics. A driver who gets used to a car improves, that is, laps faster. After 0.9 race cars lap slower, and the same drivers do it, on the same tracks, with the same cars. Habit pushes times down; the data go the opposite way.
The control: slicks against road tyres
Kunos declared that it changed the model of the slick tyres and not the road ones. This allows a clean comparison: cars on road tyres are a control group that goes through the same events (new version, same drivers, same period) but not the physics change. We applied the same model to the Alpine A110 S, Lotus Emira and Volkswagen Golf 8 R, present in both 0.8 and 0.9.
The road cars went from +0.28% (Alpine), −0.18% (Emira) and +0.51% (Golf 8 R): together +0.30% (±0.29), that is, no significant change. The race cars are between 1.0% and 2.4%. Kunos' statement is confirmed by the measurement: the change was on the race tyres.
Car by car
| Car | 0.5 → 0.6 | 0.6 → 0.7 | 0.7 → 0.8 | 0.8 → 0.9 |
|---|---|---|---|---|
| Mazda MX-5 ND Cup | +3.66% ± 0.27 | −0.02% ± 0.27 | −1.00% ± 0.31 | +2.45% ± 0.29 |
| Porsche 718 Cayman GT4 | −0.56% ± 0.29 | −0.29% ± 0.24 | +0.04% ± 0.42 | +1.30% ± 0.50 |
| Audi R8 LMS GT4 Evo | – | +0.25% ± 0.69 | −0.21% ± 0.80 | +1.29% ± 0.76 |
| Audi R8 LMS GT3 Evo II | – | – | −0.04% ± 0.47 | +1.23% ± 0.41 |
| Ferrari 296 GT3 | – | −0.02% ± 0.14 | +0.70% ± 0.21 | +0.90% ± 0.25 |
| BMW M4 GT3 Evo | – | +0.04% ± 0.33 | +0.47% ± 0.54 | +0.67% ± 0.54 |
| Ford Mustang GT3 | – | −1.08% ± 0.59 | +1.71% ± 1.11 | +0.11% ± 0.95 |
| Porsche 911 GT3 R (992) | – | −0.09% ± 0.36 | +1.19% ± 0.56 | −0.31% ± 0.53 |
Change in lap time per car, same driver and track.
- The Mazda MX-5 ND Cup is the car with the biggest change, at two moments: in 0.6 (+3.7%) and in 0.9 (+2.4%), the two versions in which the race tyre model changed.
- The GT4 cars (Porsche 718 Cayman and Audi R8 GT4) lose about 1.3%, and the fastest GT3 cars from 0.7% to 1.2%: Audi R8 GT3 +1.2%, Ferrari 296 +0.9%, BMW M4 +0.7%.
- The Ford Mustang GT3 and the Porsche 911 GT3 R (992) do not change in a measurable way with 0.9: for both the interval includes zero.
What it is worth in seconds
A percentage on the lap seems small until you turn it into time:
| Group | Change 0.8 → 0.9 | 1:30 lap | 2:00 lap | Nordschleife (8:00) |
|---|---|---|---|---|
| Road cars (road tyres) | +0.30% | +0.3 s | +0.4 s | +1.4 s |
| GT4 Super Sprint | +1.04% | +0.9 s | +1.2 s | +5.0 s |
| GT3 Sprint Cup | +1.34% | +1.2 s | +1.6 s | +6.4 s |
| The Ring (Nordschleife) | +1.40% | +1.3 s | +1.7 s | +6.7 s |
| Mazda MX-5 ND Cup | +2.44% | +2.2 s | +2.9 s | +11.7 s |
On a typical lap of each length, same driver.
In a GT3 race with a 1:40 lap that is 1.3 seconds a lap: over ten laps it is thirteen seconds. Whoever kept racing with the old setups and the same references has a gap that does not depend on their driving.
GT3 Sprint Cup deep dive: same driver, different cars
The GT3 Sprint Cup is the series with the most races and the most drivers who drive different cars on the same track. It is the chance to answer a different question: which GT3 has the best pace, without the driver factor? For every driver who drove several cars on the same track, in the same version, we compare their own cars against each other:
| Car | 0.6 | 0.7 | 0.8 | 0.9 |
|---|---|---|---|---|
| Ferrari 296 GT3 | −0.45% | −0.39% | −0.37% | −0.02% |
| Audi R8 LMS GT3 Evo II | – | −0.31% | −0.30% | −0.39% |
| BMW M4 GT3 Evo | −0.21% | −0.21% | −0.17% | −0.23% |
| Porsche 911 GT3 R (992) | −0.16% | +0.11% | +0.20% | −0.33% |
| Ford Mustang GT3 | +0.81% | +0.80% | +0.64% | +0.96% |
% on the lap against the GT3 average, same driver.
- The Ferrari 296 GT3 is the car with the best pace from 0.6 to 0.8: −0.45%, −0.39% and −0.37% against the average. With 0.9 this advantage disappears (−0.02%).
- With 0.9 the Audi R8 LMS GT3 Evo II (−0.39%) and the Porsche 911 GT3 R (−0.33%) move ahead. The Porsche, below the class average in versions 0.7 and 0.8, gains more than half a point.
- The BMW M4 GT3 Evo stays stable in all versions; the Ford Mustang GT3 is last in the class in every version, by about 0.6–1.0 points.
The GT3 hierarchy has changed with the new physics. What was true up to 0.8 (“the Ferrari is the car to get”) is no longer true in 0.9.
What to do with 0.9
- Rebuild your setups. Kunos said it and the measurements confirm it: a setup built for 0.8 on a race car works on a tyre model that no longer exists.
- Update your references. A time set in 0.8 on a race car must be moved to 0.9 with 1–2.5% more: a lap that was good before is a different time now.
- Road cars stayed the same. The references you had for them remain valid.