
M2R Simulation › Circuit guides › Brands Hatch GP in Assetto Corsa EVO: corner by corner, from real laps
Brands Hatch GP in Assetto Corsa EVO: corner by corner, from real laps
Most track guides are opinions. This one is a measurement: we took 243 valid laps of the Audi R8 LMS GT4 Evo recorded by ACE Coach and compared the 24 fastest with the laps in the middle of the field, corner by corner. The gap is 1.9 seconds, and the data shows exactly where it is.
7 min read
How the numbers were made
The laps come from nine different drivers on the Brands Hatch Grand Prix layout, all valid laps with the same car. "Fast" is the quickest tenth (median 1:28.349); "typical" is the group around the middle of the field (median 1:30.287). For each of the nine microsectors of the circuit we compared the time, the lowest speed, how much of the corner is spent on the brake and how much at full throttle.
The numbers are for the GT4 car. A faster or slower car shifts the speeds, but the pattern of where time is made is the same on any car.
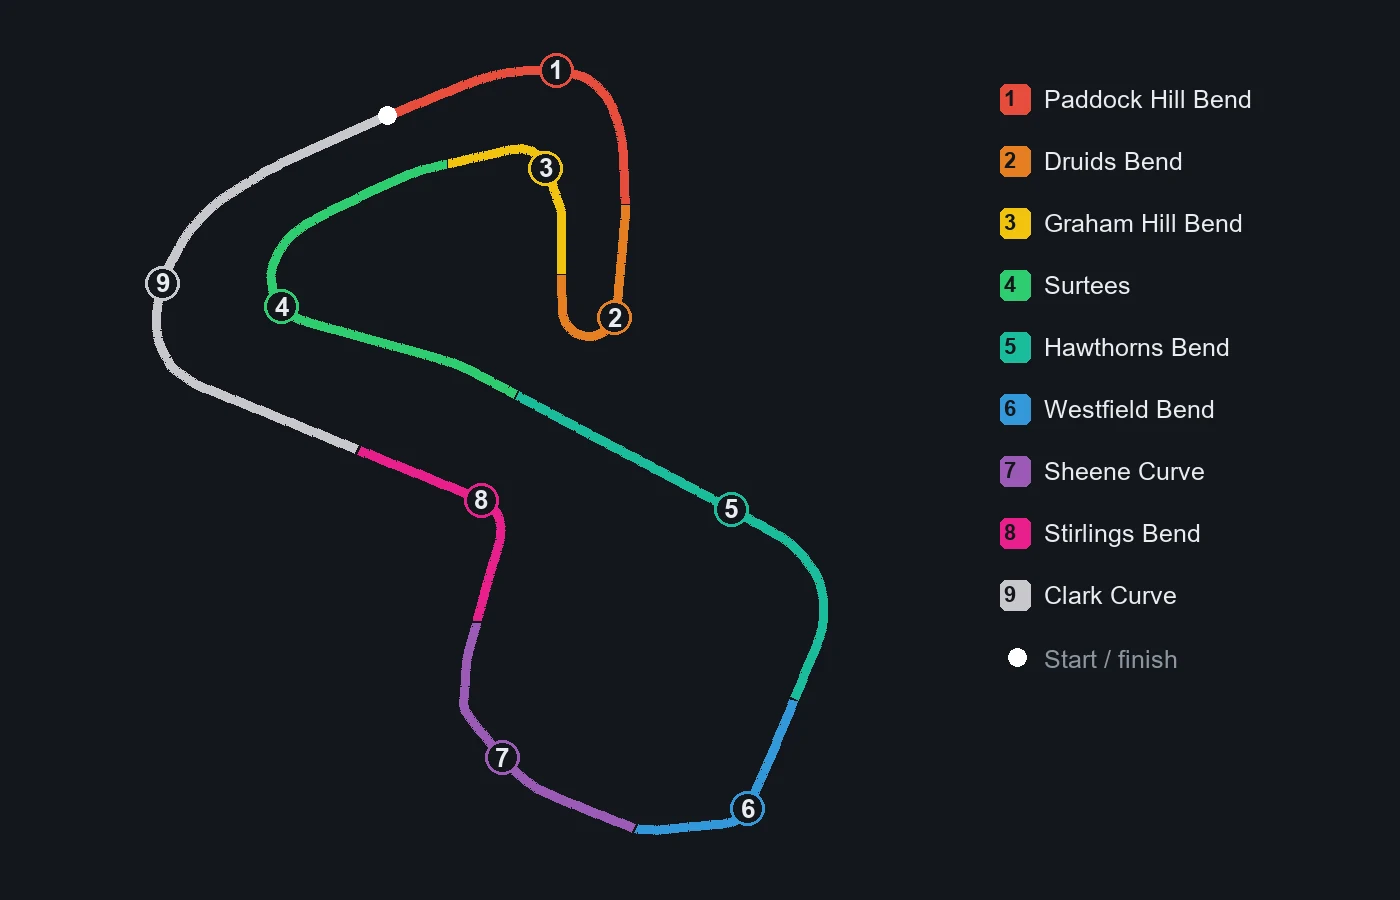
The big picture: no single corner decides the lap
The 1.9 seconds are spread almost evenly: between 0.13 and 0.26 seconds per microsector. There is no magic corner, which is good news: you do not need a heroic move, you need a small gain nine times. Druids Bend, Surtees, Hawthorns and Clark Curve are worth 0.25 to 0.26 seconds each, Graham Hill Bend only 0.13.
- The fast laps spend more time at full throttle in all nine microsectors: from 2 to 14 percentage points more.
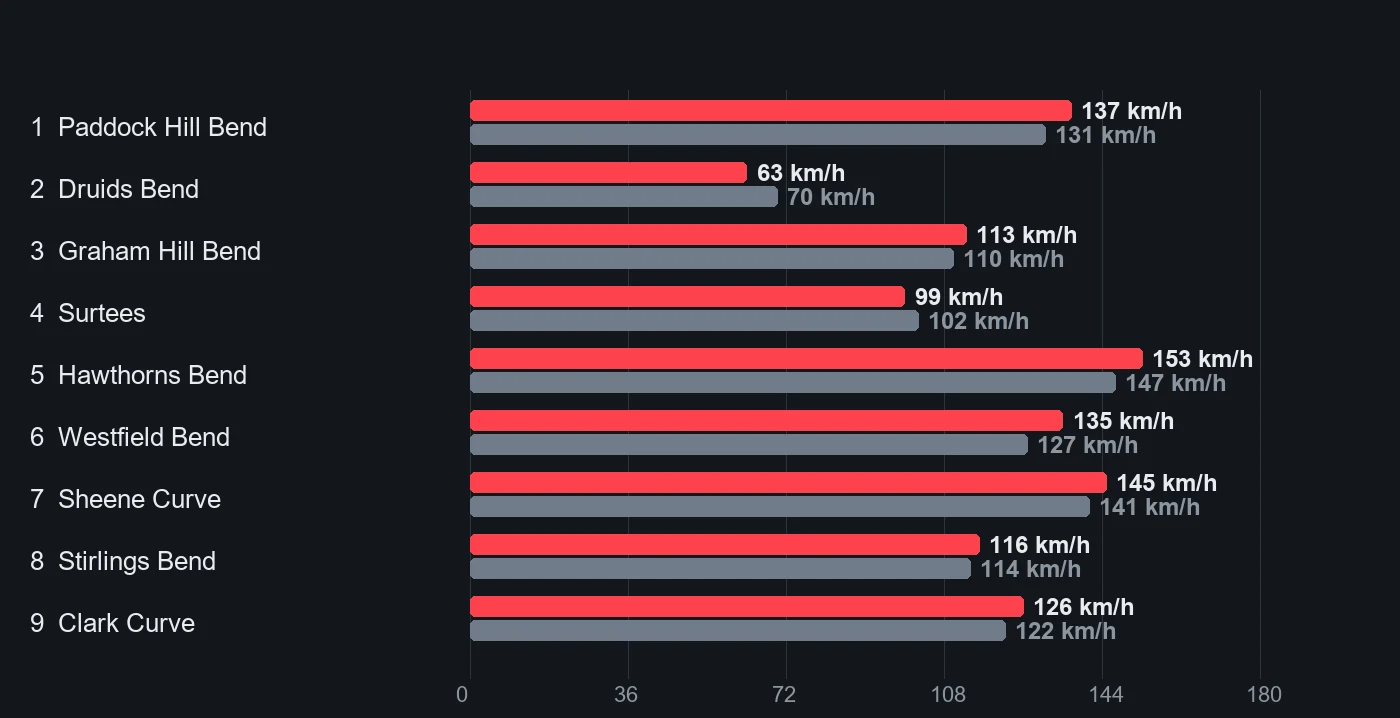
- In seven corners they also carry more speed at the slowest point, by 2 to 8 km/h.
- Braking later is not the pattern. The one corner where the fast laps brake clearly more is the Druids hairpin.
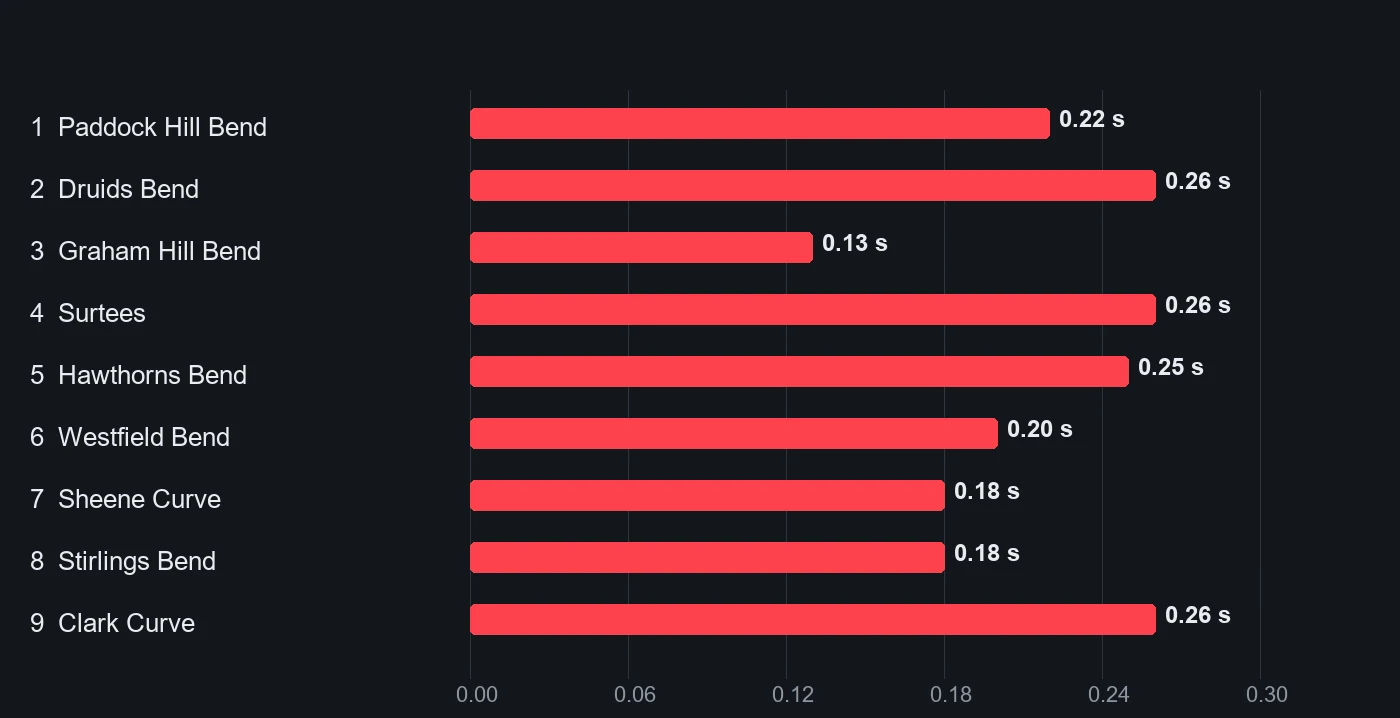
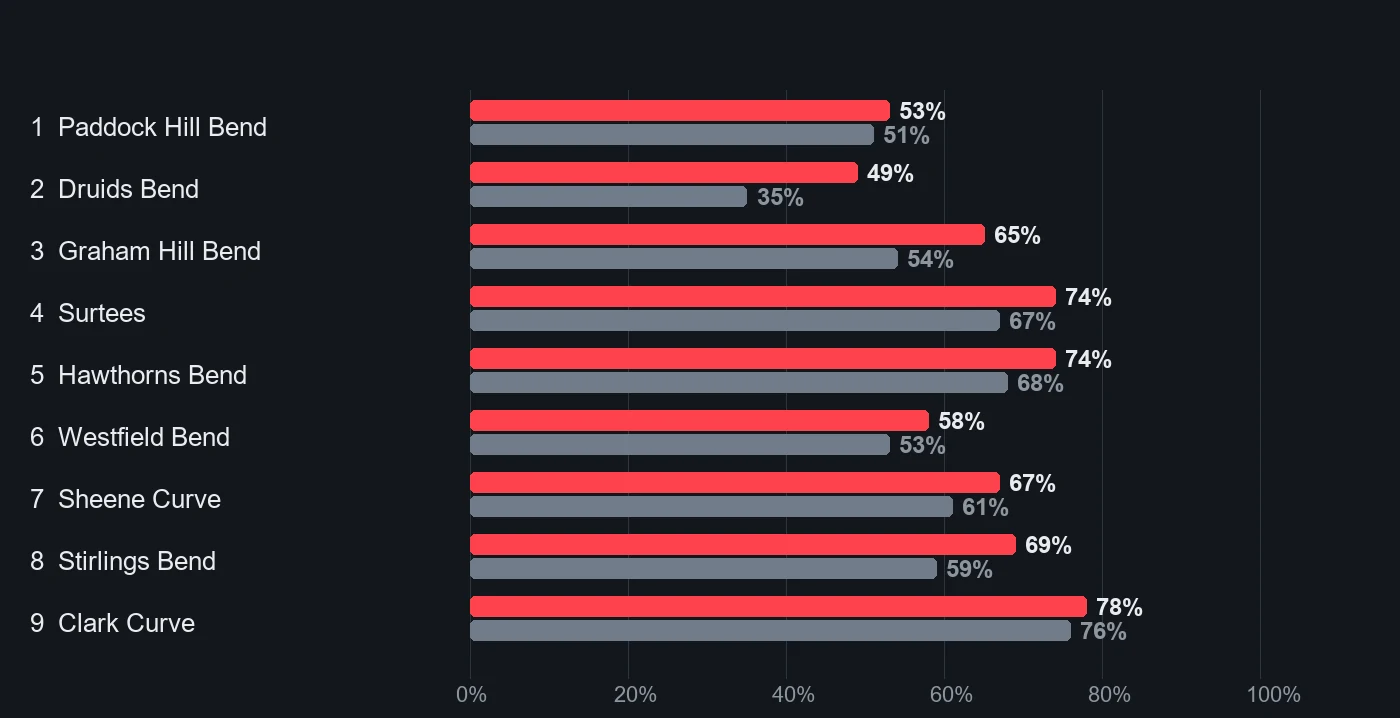
Paddock Hill Bend and Druids Bend
Paddock Hill Bend is taken 6 km/h faster at the slowest point by the fast laps (137 against 131 km/h) while the share of braking is the same: the difference is the entry speed you can carry down the hill, not a later brake. It is worth 0.22 seconds.
Druids Bend is the opposite. The fast laps go slower in the middle of the hairpin (63 against 70 km/h), brake for more of the corner (37 against 28 percent) and are at full throttle for far more of it (49 against 35 percent). They sacrifice the entry to turn the car and get on the power early. It is the corner with the biggest gain, 0.26 seconds.
Graham Hill Bend and Surtees
At Graham Hill Bend the speed is similar (113 against 110 km/h) but the fast laps are at full throttle for 65 percent of the corner against 54: they are on the power earlier, which makes the Cooper Straight start faster.
Surtees is long (631 metres) and the fast laps are slightly slower at the slowest point (99 against 102 km/h) but at full throttle for 74 percent against 67. A little less speed in the middle, earlier power on the exit: 0.26 seconds.
Hawthorns Bend and Westfield Bend
Hawthorns is a fast corner: the fast laps carry 153 km/h at the slowest point against 147 and are at full throttle for longer. Confidence on entry is the gain here, 0.25 seconds.
Westfield Bend shows the largest difference in speed: 135 against 127 km/h at the slowest point, with less braking (18 against 24 percent). The typical laps brake too much for this corner. It is worth 0.20 seconds.
Sheene Curve, Stirlings Bend and Clark Curve
Through Sheene Curve and Stirlings Bend the fast laps are a few km/h faster in the middle but the clear difference is the throttle: 67 against 61 percent at Sheene and 69 against 59 at Stirlings. Each is worth 0.18 seconds.
Clark Curve is the longest microsector (727 metres, including the run to the line) and again 0.26 seconds: 126 against 122 km/h at the slowest point and 78 against 76 percent at full throttle: a small gain that adds up on the run to the main straight.
The most common mistakes, corner by corner
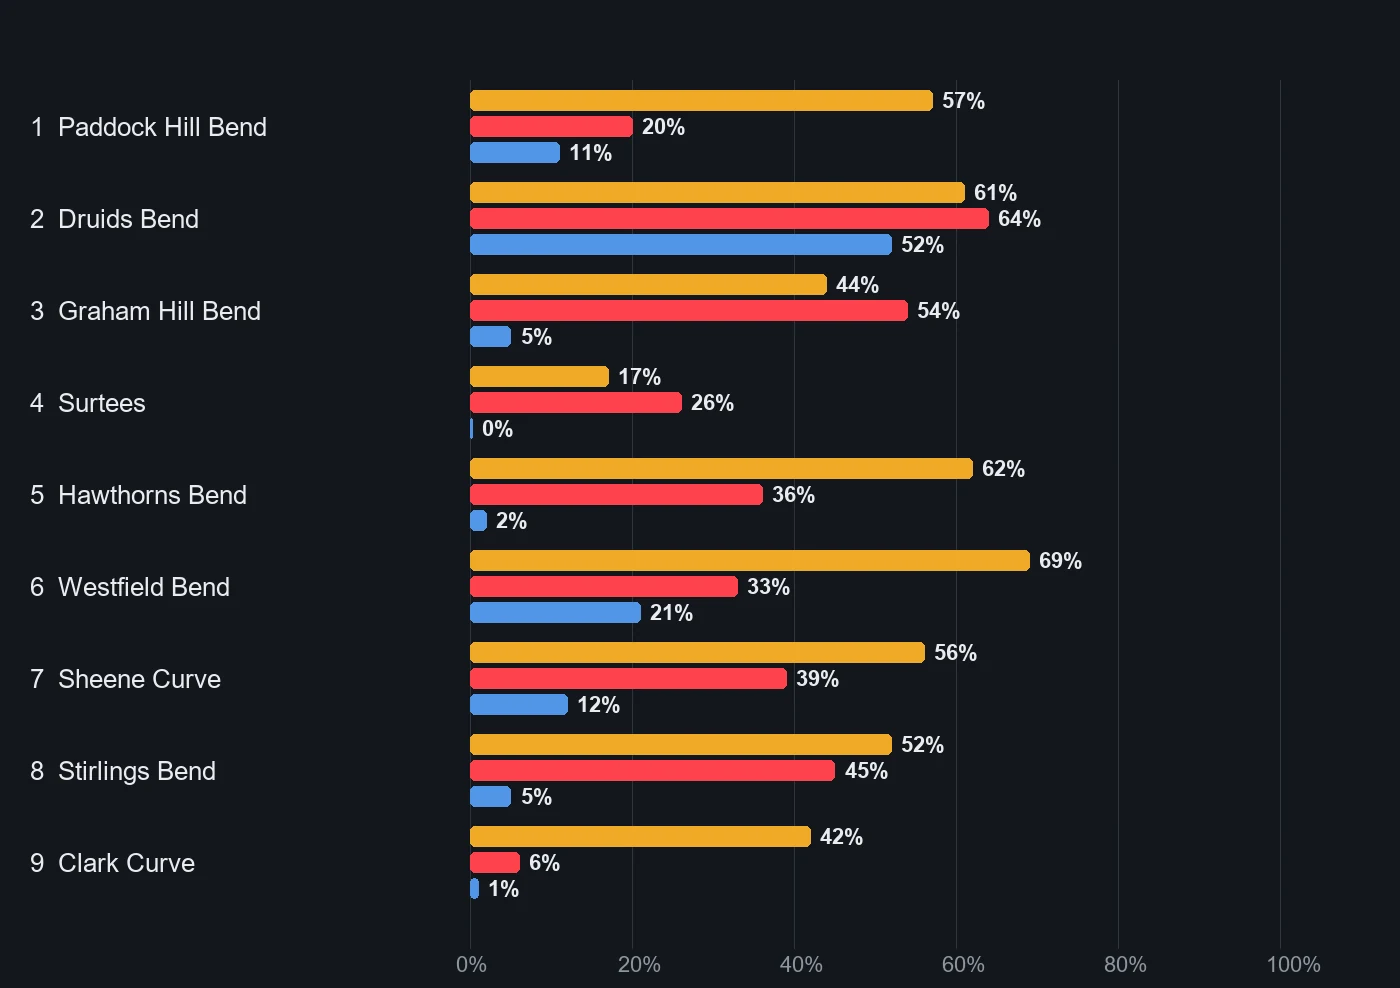
For each corner we looked at the 219 laps outside the fast group and counted how many make each of three mistakes, measured against the fast laps: slow in the middle (the slowest point is more than 4 km/h below the fast laps), late on the throttle (more than 8 points less of the corner at full throttle) and braking too long (6 points more of the corner on the brake). At Druids Bend the first and the third are reversed, because there the fast laps brake more and go slower. The time is the average loss of those laps in that microsector against the fast laps.
Two mistakes dominate the lap: not carrying enough speed through the middle of the corner (in seven of nine corners, 42 to 69 percent of the laps) and getting on the throttle late. Braking too long is rare, 21 percent at most. The usual advice to brake later is not what the data asks for: it asks you to trust the car in the middle of the corner and open the throttle earlier.
- Paddock Hill Bend: 57 percent of the laps are more than 4 km/h too slow at the slowest point (about 0.31 seconds lost) and 20 percent are late on the throttle.
- Druids Bend: 64 percent get on the throttle late (0.32 s), 61 percent are too fast at the slowest point and 52 percent brake for too short a part of the corner (0.32 s). The three mistakes go together.
- Graham Hill Bend: 54 percent are late on the throttle (0.20 s) and 44 percent are slow in the middle (0.26 s).
- Surtees: the mistakes are less common (late throttle 26 percent) but the most expensive when they happen, 0.40 s and more.
- Hawthorns Bend: 62 percent are slow in the middle (0.30 s) and 36 percent late on the throttle (0.32 s).
- Westfield Bend: the most common mistake of the lap, 69 percent slow in the middle (0.27 s), and 21 percent brake too long (0.30 s).
- Sheene Curve: 56 percent slow in the middle (0.29 s) and 39 percent late on the throttle (0.22 s).
- Stirlings Bend: 52 percent slow in the middle (0.29 s) and 45 percent late on the throttle (0.25 s).
- Clark Curve: 42 percent are slow in the middle, and it is the most expensive mistake of the lap, 0.42 s.
A plan for your next session
Do not try to fix nine corners. Pick the two where you are furthest from these numbers and work on them for ten laps each:
- Compare your lap with a faster one on the same car and look at the throttle trace first: are you at full throttle as early as the fast laps?
- Druids Bend: brake harder, slow down more, rotate the car and open the throttle early.
- Westfield Bend and Hawthorns: brake less and carry the speed; trust the grip.
- Re-check after ten laps. If the gap in that corner shrank, move to the next one.
Put it into practice with ACE Coach